Fig. 5
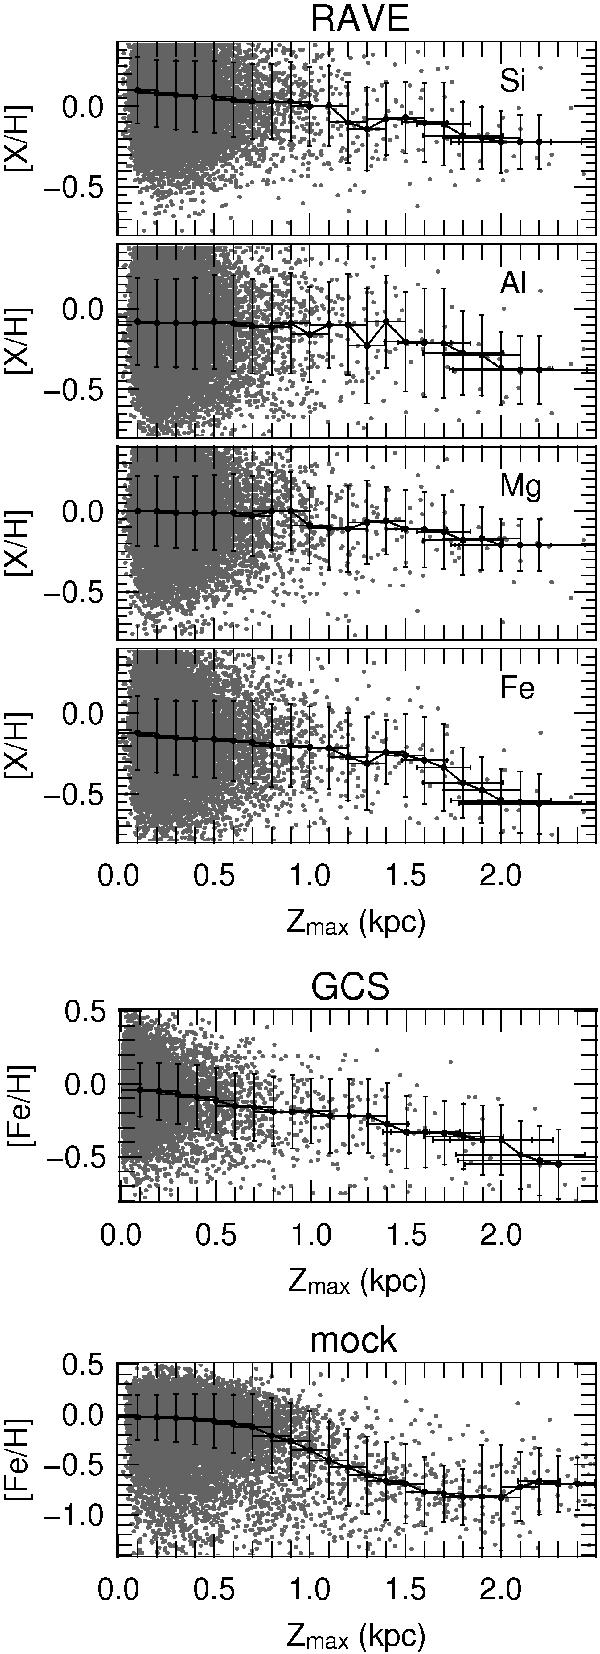
Abundance for the elements Fe, Mg, Al, and Si for the RAVE sample (top), [Fe/H] for the GCS sample (middle) and the mock sample (bottom) as a function of Zmax. The black dots connected by a line represent the median abundance. The vertical error bars indicate the standard deviation of the distribution computed in the Zmax interval indicated by the horizontal error bars.
Current usage metrics show cumulative count of Article Views (full-text article views including HTML views, PDF and ePub downloads, according to the available data) and Abstracts Views on Vision4Press platform.
Data correspond to usage on the plateform after 2015. The current usage metrics is available 48-96 hours after online publication and is updated daily on week days.
Initial download of the metrics may take a while.