Fig. 4
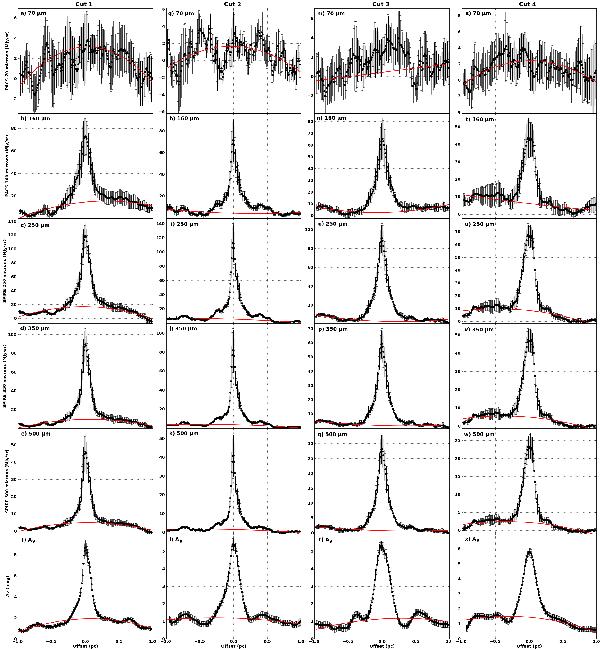
Emission brightness profiles of the first cut (see Table 2) at 70 μm a); 160 μm b); 250 μm c); 350 μm d); and 500 μm e); and extinction profile calculated from the 2MASS data with RV = 3.1 f). The same for the second cut g)–l); the third cut m)–r); and the fourth cut s)–x). The red lines show the second order polynomials fitted to remove the relatively diffuse envelope from the densest filament.
Current usage metrics show cumulative count of Article Views (full-text article views including HTML views, PDF and ePub downloads, according to the available data) and Abstracts Views on Vision4Press platform.
Data correspond to usage on the plateform after 2015. The current usage metrics is available 48-96 hours after online publication and is updated daily on week days.
Initial download of the metrics may take a while.