Fig. 2
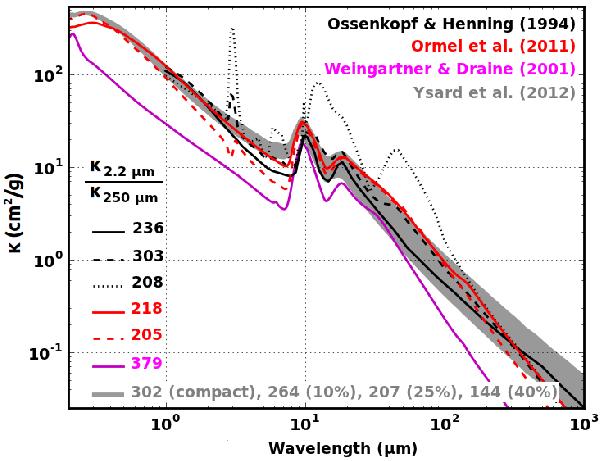
Opacity for the aggregate populations used in this paper (grey area). The magenta line shows the opacity of the dust model “A” of Weingartner & Draine (2001). We also display the opacity of the bare aggregates (black line) and of the aggregates covered by a thin (black dashed line) or thick (black dotted line) ice mantle described in Ossenkopf & Henning (1994). The red lines show the aggregate opacities computed by Ormel et al. (2011) without (solid line, their model sil, gra) and with an ice mantle (dashed line, their model ic-sil, ic-gra). The numbers on the left side of the figure give the near- to far-IR opacity ratio for these dust models.
Current usage metrics show cumulative count of Article Views (full-text article views including HTML views, PDF and ePub downloads, according to the available data) and Abstracts Views on Vision4Press platform.
Data correspond to usage on the plateform after 2015. The current usage metrics is available 48-96 hours after online publication and is updated daily on week days.
Initial download of the metrics may take a while.