Fig. A.1
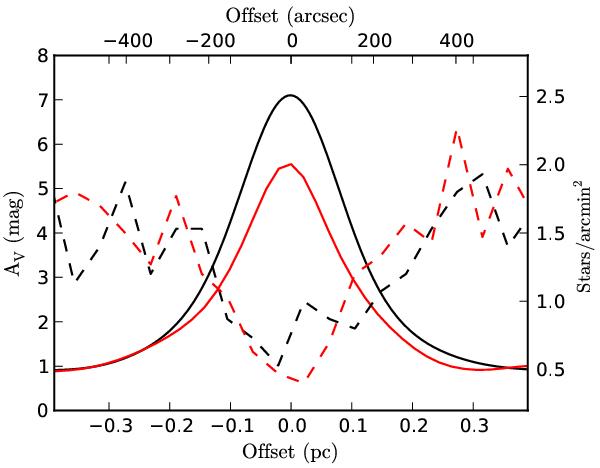
Simulation of possible bias in NICER estimates. The black solid curve shows the assumed true AV profile, convolved to a resolution of 200″. The red solid line shows the extinction profile recovered with NICER algorithm from the simulated observations. The dashed lines and the right hand scale indicate the stellar density in the case of the first cut (black dashed line) and in the simulation (red dashed line).
Current usage metrics show cumulative count of Article Views (full-text article views including HTML views, PDF and ePub downloads, according to the available data) and Abstracts Views on Vision4Press platform.
Data correspond to usage on the plateform after 2015. The current usage metrics is available 48-96 hours after online publication and is updated daily on week days.
Initial download of the metrics may take a while.