Fig. 14
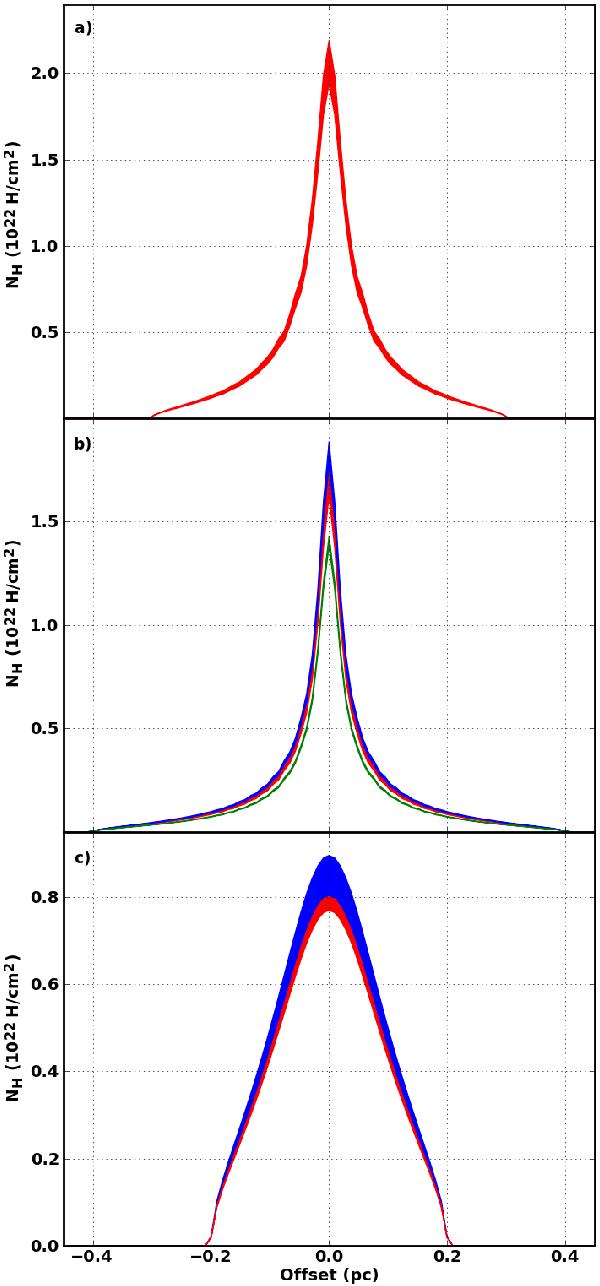
Column density distributions of the best-fitting models for cuts 1 a), 2 b), and 4 c), as a function of the offset from the filament centre. The blue areas show the best-fitting models using compact aggregates, the red areas using aggregates with 10% of voids, and the green areas with 25% of voids.
Current usage metrics show cumulative count of Article Views (full-text article views including HTML views, PDF and ePub downloads, according to the available data) and Abstracts Views on Vision4Press platform.
Data correspond to usage on the plateform after 2015. The current usage metrics is available 48-96 hours after online publication and is updated daily on week days.
Initial download of the metrics may take a while.