Fig. 13
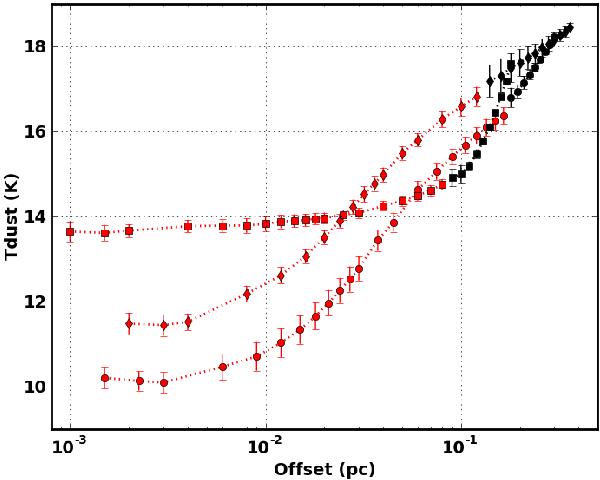
Temperature distributions of the best-fitting models for the first (bullets), the second (diamonds), and the fourth cuts (squares). The red symbols are the equilibrium temperature of the aggregates with 10% of voids, averaged over their size distribution, and the black symbols are the same for the mixture of large grains of the DHGL populations (LamC and aSil).
Current usage metrics show cumulative count of Article Views (full-text article views including HTML views, PDF and ePub downloads, according to the available data) and Abstracts Views on Vision4Press platform.
Data correspond to usage on the plateform after 2015. The current usage metrics is available 48-96 hours after online publication and is updated daily on week days.
Initial download of the metrics may take a while.