Free Access
Fig. 12
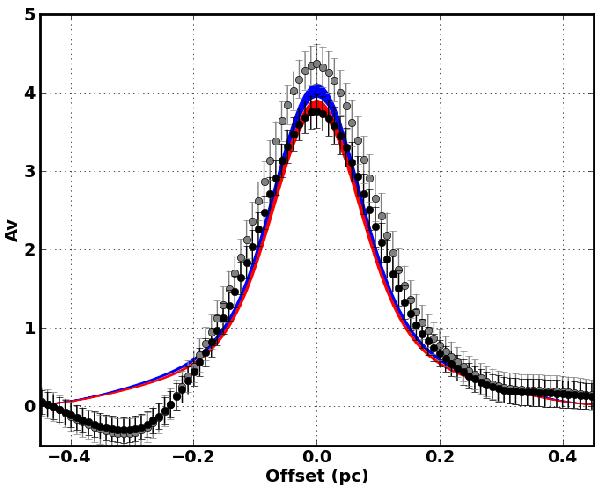
Extinction profile of the fourth cut calculated from 2MASS data with RV = 3.1 (grey dots) and RV = 5.5 (black dots). The blue and red areas correspond to the best-fitting models presented in Fig. 11.
Current usage metrics show cumulative count of Article Views (full-text article views including HTML views, PDF and ePub downloads, according to the available data) and Abstracts Views on Vision4Press platform.
Data correspond to usage on the plateform after 2015. The current usage metrics is available 48-96 hours after online publication and is updated daily on week days.
Initial download of the metrics may take a while.