Fig. 5
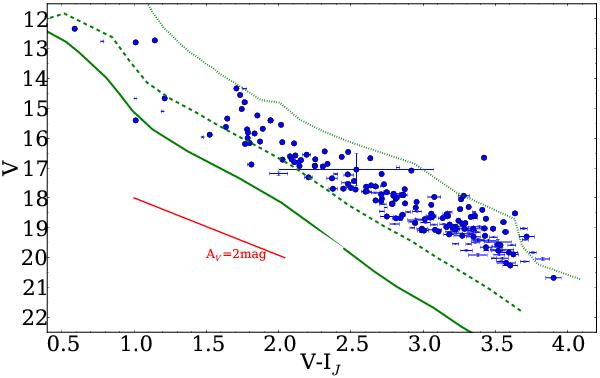
V vs. V − I (Johnsons system) diagram of the members (large filled circles) and probable members (small points) found in this survey. For comparison, the Siess et al. (2000) isochrones for 1, 10, and 100 Myr are displayed, transformed into the Johnsons system according to Fernie (1983) and Getman et al. (2012). An extinction vector (Cardelli et al. 1989) is also displayed. Errorbars (considering the photometric and AV errors) are also displayed, although they are often smaller than the symbols.
Current usage metrics show cumulative count of Article Views (full-text article views including HTML views, PDF and ePub downloads, according to the available data) and Abstracts Views on Vision4Press platform.
Data correspond to usage on the plateform after 2015. The current usage metrics is available 48-96 hours after online publication and is updated daily on week days.
Initial download of the metrics may take a while.