Fig. 3
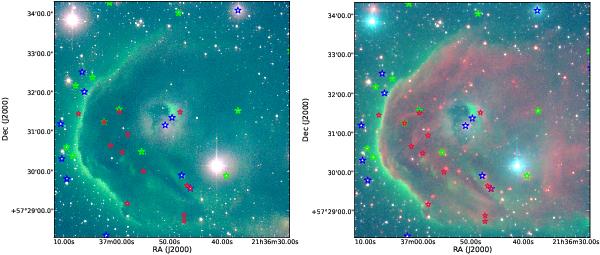
Two 3-color images of the IC 1396 A globule. Left: narrow band at 6750 Å, [S II] combined at 6716 and 6730 Å, and R band as red, green, and blue, respectively. Right: IRAC1, [S II] combined at 6716 and 6730 Å, and R band as red, green, and blue, respectively. Known members detected via optical spectroscopy are marked as blue stars, new members are marked as green stars. Spitzer embedded candidates (SA06a) are marked by red stars.
Current usage metrics show cumulative count of Article Views (full-text article views including HTML views, PDF and ePub downloads, according to the available data) and Abstracts Views on Vision4Press platform.
Data correspond to usage on the plateform after 2015. The current usage metrics is available 48-96 hours after online publication and is updated daily on week days.
Initial download of the metrics may take a while.