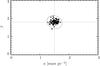
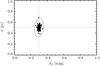
Fig. 1
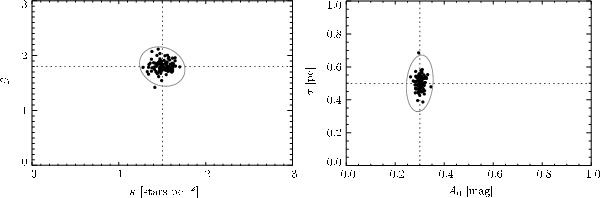
Maximum likelihood best-fit parameters for a set of 100 simulations. The dotted lines show the true, original values used: κ = 1.5 star pc-2, β = 1.8, A0 = 0.3 mag, and σ = 0.5 pc. Note how the points, representing the individual best-fits, cluster around the true values. The ellipses, showing the expected 3-σ errors as deduced from the Fischer information matrix, are in excellent agreement with the observed distribution of points.
Current usage metrics show cumulative count of Article Views (full-text article views including HTML views, PDF and ePub downloads, according to the available data) and Abstracts Views on Vision4Press platform.
Data correspond to usage on the plateform after 2015. The current usage metrics is available 48-96 hours after online publication and is updated daily on week days.
Initial download of the metrics may take a while.