Fig. 7
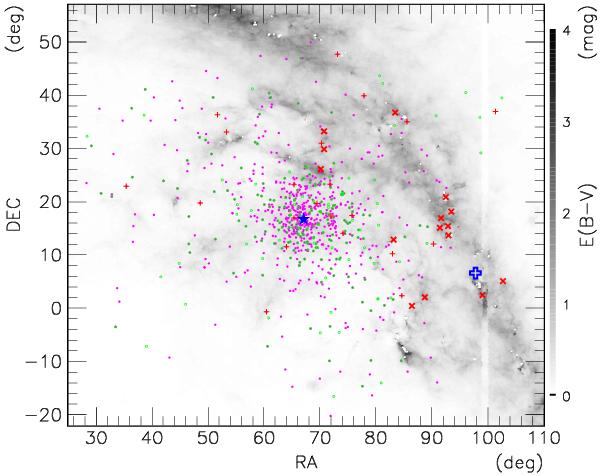
Schlegel excess map of E(B − V) (Schlegel et al. 1998), with the darkest areas having the largest excess. The Hyades candidates are super-imposed: green circles for the candidates detected in PS1, with low reddening; red crosses and pluses: candidates suspected to be giants (see Fig. 6) or to have bad proper motion measurements; magenta dots for R11. The blue diamond shows the convergent point.
Current usage metrics show cumulative count of Article Views (full-text article views including HTML views, PDF and ePub downloads, according to the available data) and Abstracts Views on Vision4Press platform.
Data correspond to usage on the plateform after 2015. The current usage metrics is available 48-96 hours after online publication and is updated daily on week days.
Initial download of the metrics may take a while.