Fig. 6
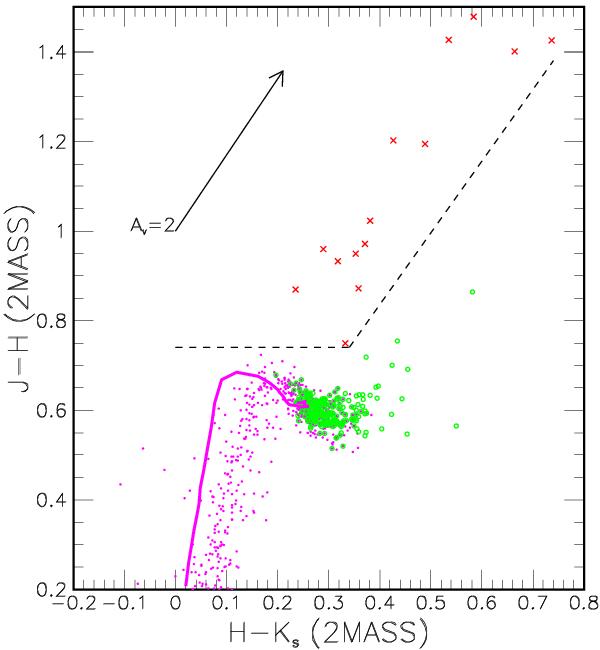
Near-infrared colour–colour diagram of our candidates, after the selection in the optical-near-infrared CMDs. The R11 candidates appear as magenta dots, the new candidates as green circles, and red crosses show kinematical candidates with suspiciously high reddening. Objects located above the dashed lines are rejected as background stars (red crosses). The BT-Settl model 600-Myr isochrone down to 0.07 M⊙ is shown as the thick (magenta) line, and the reddening vector (RV = 3.1) as the black arrow.
Current usage metrics show cumulative count of Article Views (full-text article views including HTML views, PDF and ePub downloads, according to the available data) and Abstracts Views on Vision4Press platform.
Data correspond to usage on the plateform after 2015. The current usage metrics is available 48-96 hours after online publication and is updated daily on week days.
Initial download of the metrics may take a while.