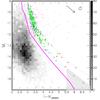
Fig. 4
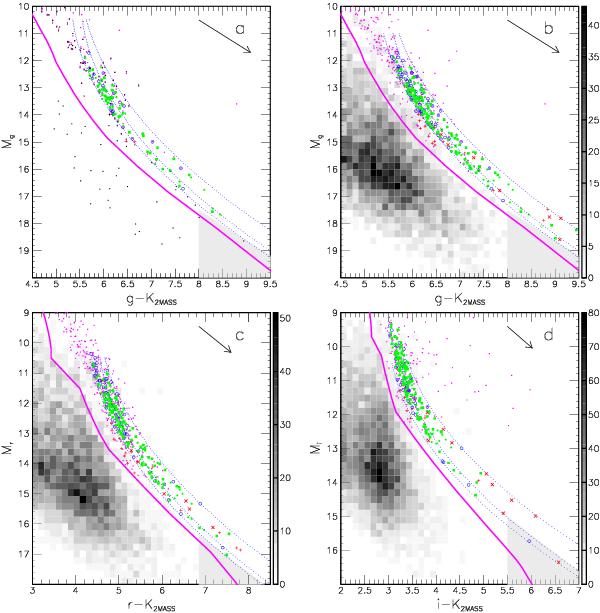
a) Colour–magnitude diagram of gP1 − K2MASS for all the kinematic candidates with |v⊥| < 2 km s-1 within 9 pc of the cluster centre. b), c), d) Hess diagrams of gP1 − K2MASS, of rP1 − K2MASS, and of iP1 − K2MASS, for the all kinematic candidates, i.e. with |v⊥| < 4 km s-1 up to 30 pc from the cluster centre. Filled (green) circles indicate candidates selected in g, r and i; open (blue) circles: candidates selected in one or two filters; (red) crosses and pluses: candidates suspected to be giants (see Fig. 6) or to have bad proper motion measurements. Dots (magenta) represent R11 Hyades candidates with CMC14 r-band photometry in c) and PS1 and SDSS photometry in a), b), d). The dotted lines (blue) indicate our selection zone, while the thick (magenta) line represents the BT-Settl model 600-Myr isochrone. The grey area at the faint, red edge shows our incompleteness limit.
Current usage metrics show cumulative count of Article Views (full-text article views including HTML views, PDF and ePub downloads, according to the available data) and Abstracts Views on Vision4Press platform.
Data correspond to usage on the plateform after 2015. The current usage metrics is available 48-96 hours after online publication and is updated daily on week days.
Initial download of the metrics may take a while.