Free Access
Fig. 3
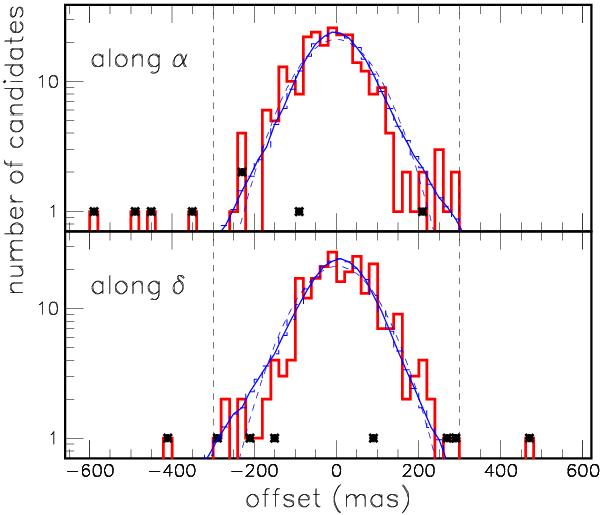
Histograms of the offsets along RA and Dec between the expected and observed positions of the 247 candidates (thick line) and nearby field objects (normalized; thin line, with the fitted Gaussian as dashed line). The eight candidates with an offset larger than 300 mas are highlighted.
Current usage metrics show cumulative count of Article Views (full-text article views including HTML views, PDF and ePub downloads, according to the available data) and Abstracts Views on Vision4Press platform.
Data correspond to usage on the plateform after 2015. The current usage metrics is available 48-96 hours after online publication and is updated daily on week days.
Initial download of the metrics may take a while.