Fig. 2
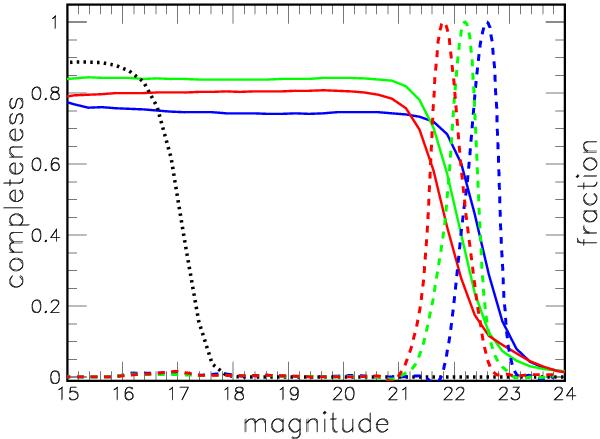
Completeness of PS1 as a function of g (blue), r (green), and i (red) SDSS magnitudes (solid curves, right to left), and histograms of the 50% completeness limit (dashed curves, normalized to unity). The similar completeness of CMC14 as a function of r SDSS magnitude is shown (dotted curve, black). The maximum reflects the fraction of the area observed in each filter.
Current usage metrics show cumulative count of Article Views (full-text article views including HTML views, PDF and ePub downloads, according to the available data) and Abstracts Views on Vision4Press platform.
Data correspond to usage on the plateform after 2015. The current usage metrics is available 48-96 hours after online publication and is updated daily on week days.
Initial download of the metrics may take a while.