Fig. 16
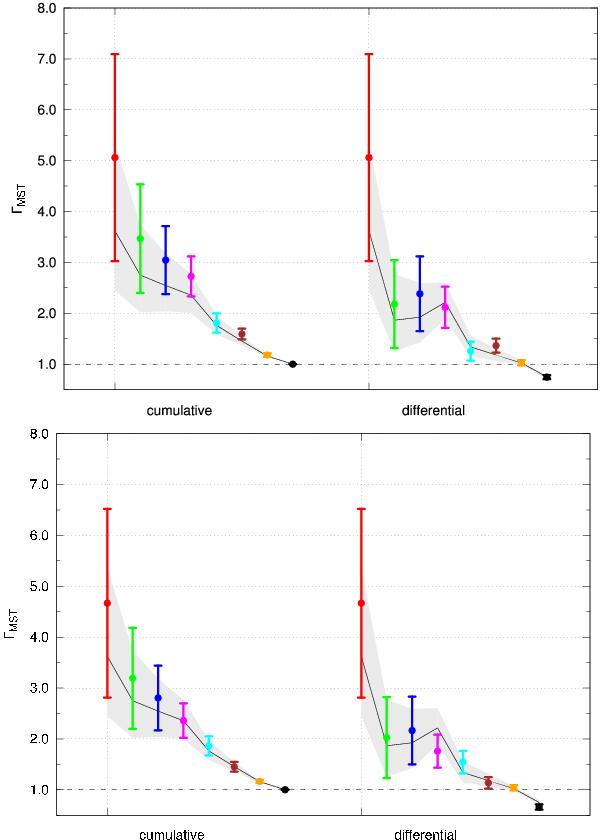
Mass segregation analysis of our Hyades data and comparison with Ernst et al. (2011). Top: full sample (candidates with |v⊥| < 4 km s-1). Bottom: reduced sample with velocity cut as explained in the text and statistical removal of contaminants. The left hand-side shows the “cumulative” ΓMST (points) for the 5 (red), 10 (green), 20 (blue), 50 (magenta), 100 (cyan), 200 (brown), 500 (orange) most massive, and all stars (black). The right-hand side shows the “differential” ΓMST (points) for the 5 (red), 6–10 (green), 11–20 (blue), 21–50 (magenta), 51–100 (cyan), 101–200 (brown), 201–500 (orange) most massive stars, and the remainder (black). The error bars mark the 1-σ uncertainties ΔΓMST. The black solid line and the grey region represent ΓMST and ΔΓMST for the data of R11, respectively.
Current usage metrics show cumulative count of Article Views (full-text article views including HTML views, PDF and ePub downloads, according to the available data) and Abstracts Views on Vision4Press platform.
Data correspond to usage on the plateform after 2015. The current usage metrics is available 48-96 hours after online publication and is updated daily on week days.
Initial download of the metrics may take a while.