Fig. 8
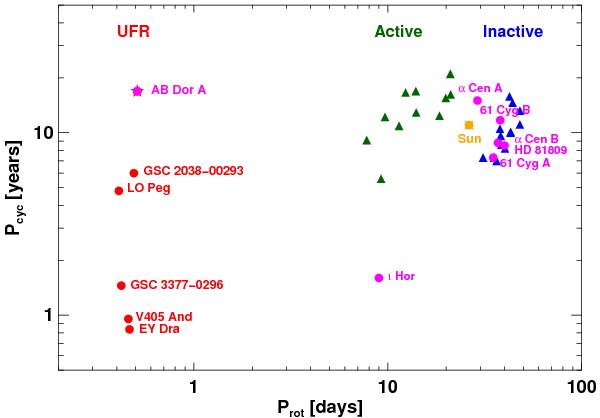
Rotation period plotted as a function of the activity-cycle period. Depicted as blue and green triangles are stars belonging to inactive and active sequence (Böhm-Vitense 2007). Represented as a magenta circles are stars with X-ray cycles (cf. see introduction). The place of AB Dor A is represented as magenta star. Depicted as red circles are the activity cycles reported in other ultra-fast rotators reported by Bernhard & Frank (2006), Taš (2011), and Vida et al. (2013).
Current usage metrics show cumulative count of Article Views (full-text article views including HTML views, PDF and ePub downloads, according to the available data) and Abstracts Views on Vision4Press platform.
Data correspond to usage on the plateform after 2015. The current usage metrics is available 48-96 hours after online publication and is updated daily on week days.
Initial download of the metrics may take a while.