Free Access
Fig. 7
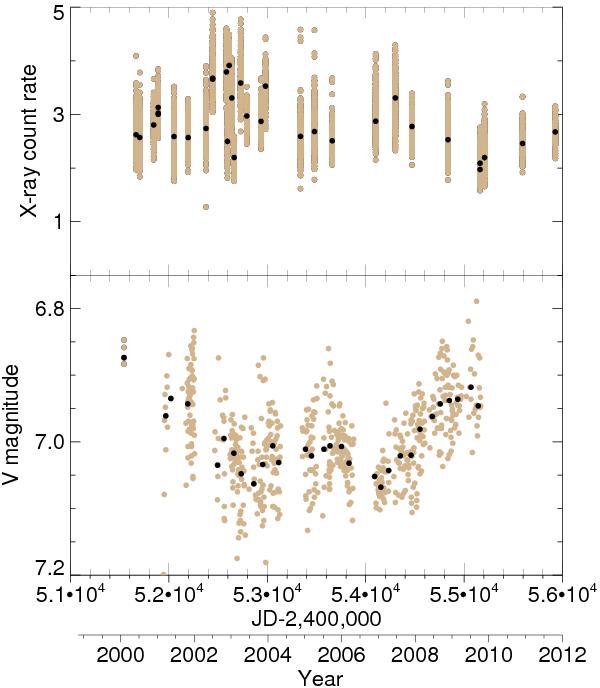
Top panel: temporal behaviour of the XMM-RGS count rate binned to 100 s (as brown circles) after removing the flares from each observation. The median count rate over the duration of each observational run is depicted as black circles. Bottom panel: V-band data for AB Dor A (same as Fig. 2).
Current usage metrics show cumulative count of Article Views (full-text article views including HTML views, PDF and ePub downloads, according to the available data) and Abstracts Views on Vision4Press platform.
Data correspond to usage on the plateform after 2015. The current usage metrics is available 48-96 hours after online publication and is updated daily on week days.
Initial download of the metrics may take a while.