Free Access
Fig. 6
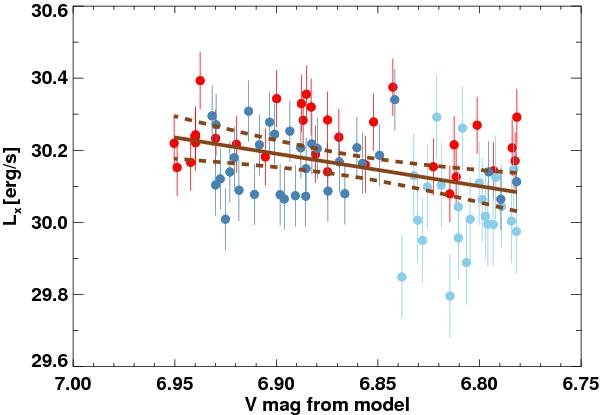
Variation of X-ray luminosity as a function of the (calculated) V magnitude. The symbols here are the same as in Fig. 5; see text for details. Plotted as brown lines are the linear regression with 2σ confidence band.
Current usage metrics show cumulative count of Article Views (full-text article views including HTML views, PDF and ePub downloads, according to the available data) and Abstracts Views on Vision4Press platform.
Data correspond to usage on the plateform after 2015. The current usage metrics is available 48-96 hours after online publication and is updated daily on week days.
Initial download of the metrics may take a while.