Fig. 5
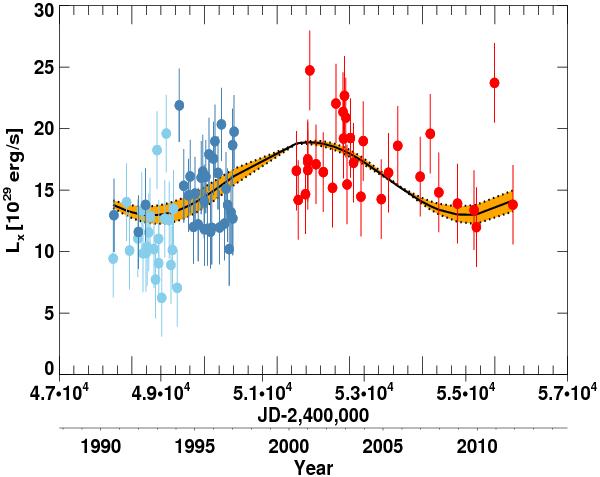
Temporal behaviour of the soft X-ray luminosity with 1σ deviation as observed by several X-ray missions between 1990 and 2011. ROSAT PSPC data are plotted as light-blue filled circles; ROSAT HRI data are depicted as navy-blue filled circles. The red circles represent XMM-Newton RGS observations. Plotted as a thick black curve is sinusoidal fit to the X-ray data with an optical-cycle period of ≈17 years.
Current usage metrics show cumulative count of Article Views (full-text article views including HTML views, PDF and ePub downloads, according to the available data) and Abstracts Views on Vision4Press platform.
Data correspond to usage on the plateform after 2015. The current usage metrics is available 48-96 hours after online publication and is updated daily on week days.
Initial download of the metrics may take a while.