Fig. 4
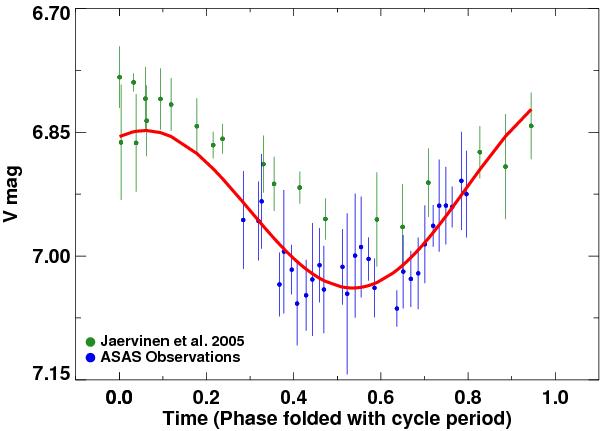
Optical V-band brightness data of Fig. 2 folded with a cycle period of 16.96 years versus the phase interval [0.0, 1.0]. Plotted in green and blue are the mean of the Järvinen et al. (2005) and ASAS observations, respectively; the plotted error bar depicts the brightness measurement distribution due to rotational modulation.
Current usage metrics show cumulative count of Article Views (full-text article views including HTML views, PDF and ePub downloads, according to the available data) and Abstracts Views on Vision4Press platform.
Data correspond to usage on the plateform after 2015. The current usage metrics is available 48-96 hours after online publication and is updated daily on week days.
Initial download of the metrics may take a while.