Fig. 5
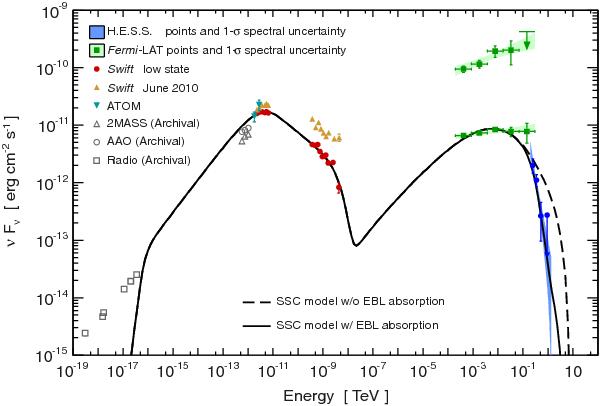
Spectral energy distribution of PKS 0301−243. Shown are the H.E.S.S. spectrum with uncertainty given at 1σ C.L., bow tie plots corresponding to the Fermi/LAT 1σ spectral uncertainties for both low state and flaring state with measurements, ATOM data in R and B bands where the error bars represent the measured variability (see text for details), and Swift/UVOT and XRT data for the low state and the 2010 observations. Archival data in radio and infrared extracted from NED are also shown. Data in X-ray and optical bands are corrected for Galactic absorption. The black lines correspond to the SSC model with (thick) and without (dashed) EBL absorption. The EBL model is taken from Franceschini et al. (2008).
Current usage metrics show cumulative count of Article Views (full-text article views including HTML views, PDF and ePub downloads, according to the available data) and Abstracts Views on Vision4Press platform.
Data correspond to usage on the plateform after 2015. The current usage metrics is available 48-96 hours after online publication and is updated daily on week days.
Initial download of the metrics may take a while.