Free Access
Fig. 4
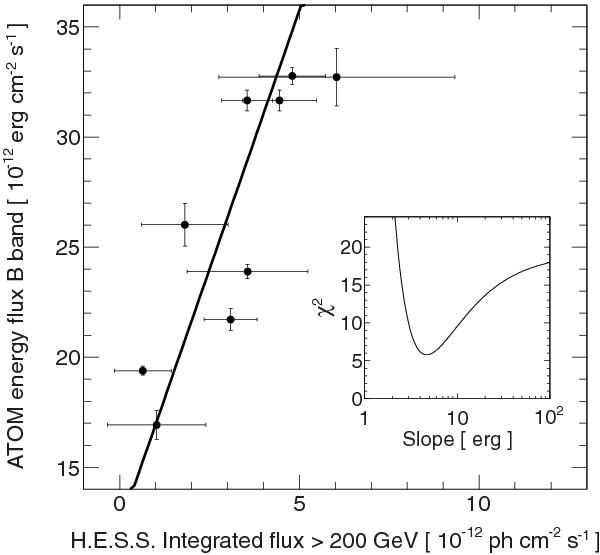
Nine simultaneous measurements of energy flux in R band by ATOM and integrated flux above 200 GeV by H.E.S.S. The line is the best fit of a linear function to the data. The inset shows the χ2 profile when varying the slope of the linear law.
Current usage metrics show cumulative count of Article Views (full-text article views including HTML views, PDF and ePub downloads, according to the available data) and Abstracts Views on Vision4Press platform.
Data correspond to usage on the plateform after 2015. The current usage metrics is available 48-96 hours after online publication and is updated daily on week days.
Initial download of the metrics may take a while.