Fig. 3
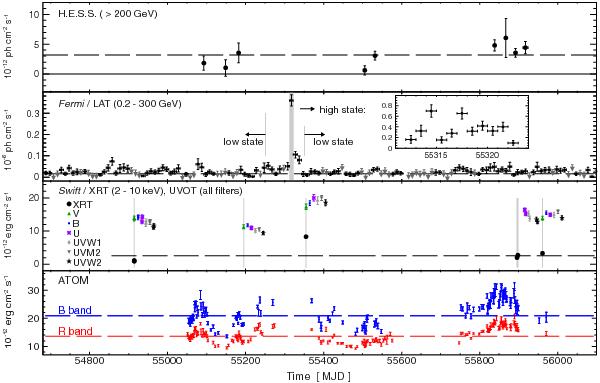
Multi-wavelength light curves for PKS 0301−243 for the period MJD 54 600 (May 14, 2008) to MJD 56 201 (October 1, 2012). From top to bottom: Panel 1: VHE light curve from H.E.S.S. data, the dashed line is the average integrated flux over all observations. The solid line corresponds to a null flux. Panel 2: LAT data with 10 days integration bins, the inset is a zoom on the high-state period with one-day integration bins. The dashed line is the best fit of the low state points to a constant. Panel 3: Swift/XRT observation light curve for integrated flux between 2 and 10 keV. The error bars for the Swift/XRT measurements are too small to be distinguishable in this plot. No data are shown around MJD 55 195 (December 30, 2009) because of insufficient statistics for a spectral fit. The dashed line is the best fit of these data to a constant. The light curves of UVOT data for all filters are also shown. For clarity, for each pointed observation (marked with grey solid lines), the UVOT results for the different filters are shifted along the increasing time axis, following the order V, B, U, UVW1, UVM2, UVW2. Panel 4: ATOM light curve in B and R bands, with one exposure per night contemporaneous with H.E.S.S. observations. The dashed horizontal lines are the best fit of a constant to the data.
Current usage metrics show cumulative count of Article Views (full-text article views including HTML views, PDF and ePub downloads, according to the available data) and Abstracts Views on Vision4Press platform.
Data correspond to usage on the plateform after 2015. The current usage metrics is available 48-96 hours after online publication and is updated daily on week days.
Initial download of the metrics may take a while.