Fig. 2
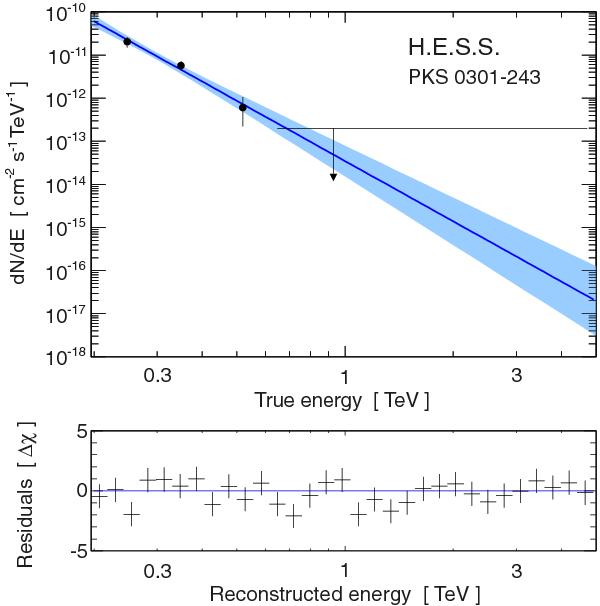
Forward folded spectrum of PKS 0301−243. Top panel: the blue line is the best fit of a power law to the data as a function of the true energy (unfolded from H.E.S.S. response functions). The points are an unfolded representation of the data assuming the best fit spectrum. The blue bow tie plot is the uncertainty of the fit given at a confidence level (C.L.) of 1σ. Upper limits are given at 3σ C.L. with Feldman & Cousins (1998) confidence intervals. Bottom panel: residuals of the fit normalized to the errors as a function of the reconstructed (measured) energy. The blue line corresponds to the no-deviation case.
Current usage metrics show cumulative count of Article Views (full-text article views including HTML views, PDF and ePub downloads, according to the available data) and Abstracts Views on Vision4Press platform.
Data correspond to usage on the plateform after 2015. The current usage metrics is available 48-96 hours after online publication and is updated daily on week days.
Initial download of the metrics may take a while.