Free Access
Fig. 1
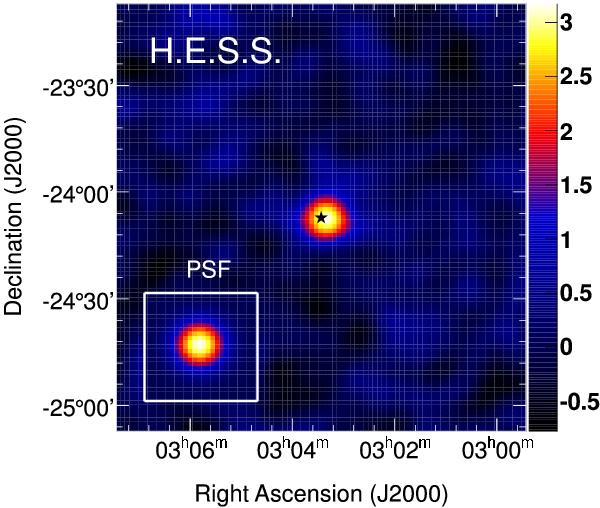
Smoothed γ-ray excess map of H.E.S.S. events in units of counts per arcmin2 centred on the position of PKS 0301−243 (see text for details). The PSF is shown in the inset. The star marks the position of PKS 0301−243 as measured in the infrared.
Current usage metrics show cumulative count of Article Views (full-text article views including HTML views, PDF and ePub downloads, according to the available data) and Abstracts Views on Vision4Press platform.
Data correspond to usage on the plateform after 2015. The current usage metrics is available 48-96 hours after online publication and is updated daily on week days.
Initial download of the metrics may take a while.