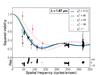
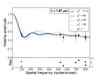
Fig. 3

Left: the AMBER (crosses: 2008; pentagons: 2012), PTI (circles) and IOTA (plusses) H band squared visibilities. Right: the CHARA Array CLASSIC (diamonds) and CLIMB (squares) H band visibility amplitudes. The red triangles are the 2007 AMBER data, which are treated separately. In both plots the same five geometric star+ring models are depicted. The full blue and green, dashed cyan, and dot-dashed magenta lines are models with inner diameters and widths equal to 3.0 and 4.6, 4.1 and 4.0, 1.0 and 5.5, and 5.0 and 2.5 mas, respectively. The dotted red line is the best-fit model to the 2007 AMBER data (see text). The legend denotes the  value of the corresponding model, except for the red one, which formally has too few data points.
Current usage metrics show cumulative count of Article Views (full-text article views including HTML views, PDF and ePub downloads, according to the available data) and Abstracts Views on Vision4Press platform.
Data correspond to usage on the plateform after 2015. The current usage metrics is available 48-96 hours after online publication and is updated daily on week days.
Initial download of the metrics may take a while.