Fig. 9
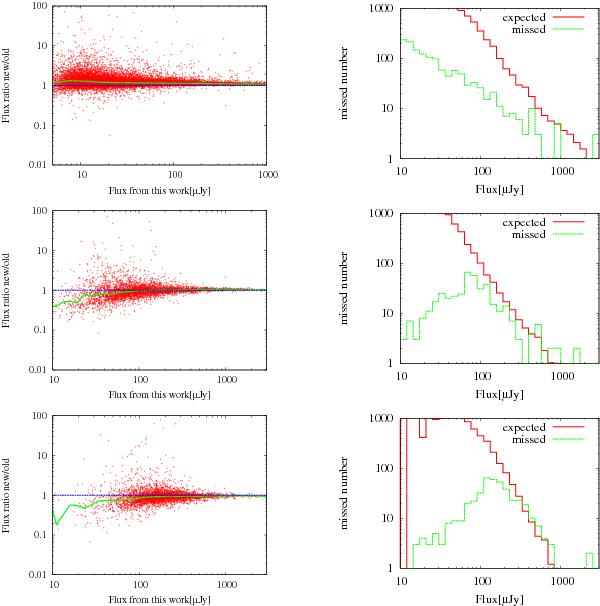
Comparison between the new and old catalogues. From top to bottom, the N3, S11, and L15 catalogues are compared. Left: comparison of the fluxes for sources detected in the new and old catalogues. The green solid lines show the median line, blue dashed lines show line of unity. Right: the green dashed lines show the flux distribution of previous catalogue sources that are not detected in this work. The red solid lines show the expected number of missing objects, calculated from the completeness.
Current usage metrics show cumulative count of Article Views (full-text article views including HTML views, PDF and ePub downloads, according to the available data) and Abstracts Views on Vision4Press platform.
Data correspond to usage on the plateform after 2015. The current usage metrics is available 48-96 hours after online publication and is updated daily on week days.
Initial download of the metrics may take a while.