Fig. 9
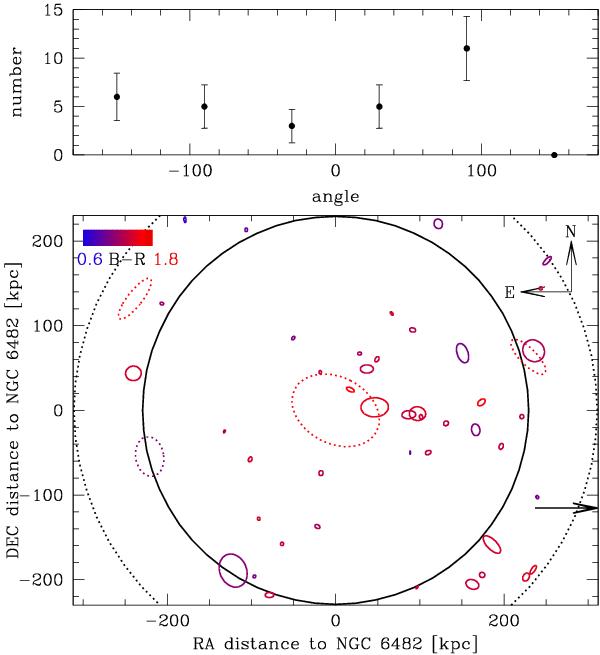
Lower panel: spatial distribution of all galaxies considered group members (blue and red sequence, see Sect. 3.2.2). Spectroscopically confirmed group members are denoted by dotted shapes. All objects are color-coded with respect to their B − R color, and the size of each galaxy is scaled to its luminosity by roughly L0.03. Ellipticity and position angle are represented by its value at the half-light radius. The solid circle represents the area that is completely covered by our field of view (r = 229 kpc). The size of the dotted circle corresponds to the virial radius (rvir = 310 kpc). The arrow in the southwest corner indicates that another spectroscopically confirmed cluster member lies outside the field of view. Upper panel: angular distribution of all galaxies shown in the lower panel within the solid circle. The 0 deg position is north in the lower panel and the angle grows clockwise. The errors in this plot are Poissonian.
Current usage metrics show cumulative count of Article Views (full-text article views including HTML views, PDF and ePub downloads, according to the available data) and Abstracts Views on Vision4Press platform.
Data correspond to usage on the plateform after 2015. The current usage metrics is available 48-96 hours after online publication and is updated daily on week days.
Initial download of the metrics may take a while.