Fig. 2
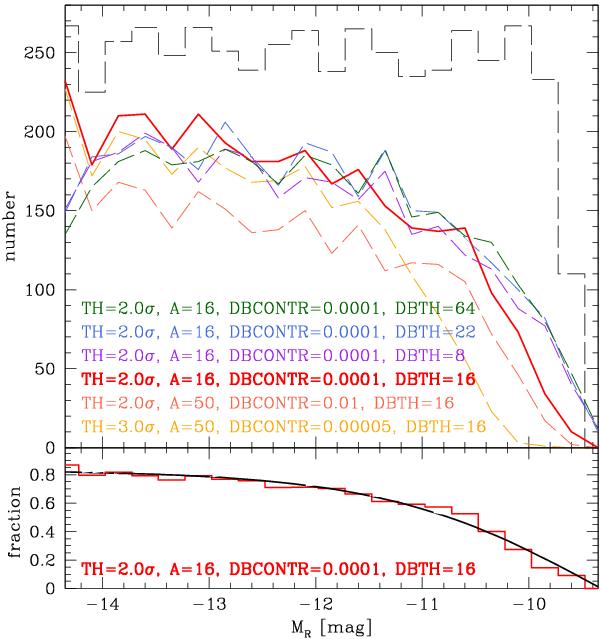
Determination of optimal SExtractor parameters. Upper panel: selection of tested SExtractor parameter sets. Colored curves show SExtractor detection number counts for different setups (TH: detection threshold; A: minimum area of pixels above threshold; DBTH: number of deblending subthreshold; DBCONTR: deblending contrast). The black, dashed histogram indicates the number of simulated galaxies in each magnitude bin. The red solid line represents our final choice, since it provides an optimal balance between the fraction of recovered objects and the detection of spurious ones. Lower panel: the red, solid histogram shows the fraction of recovered simulated galaxies using the optimal parameter set. The black solid line is a fit to the red histogram (i.e., our completeness function). Owing to crowding incompleteness (high foreground star density), the recovery completeness saturates at 80% for the brightest sources.
Current usage metrics show cumulative count of Article Views (full-text article views including HTML views, PDF and ePub downloads, according to the available data) and Abstracts Views on Vision4Press platform.
Data correspond to usage on the plateform after 2015. The current usage metrics is available 48-96 hours after online publication and is updated daily on week days.
Initial download of the metrics may take a while.