Fig. 12
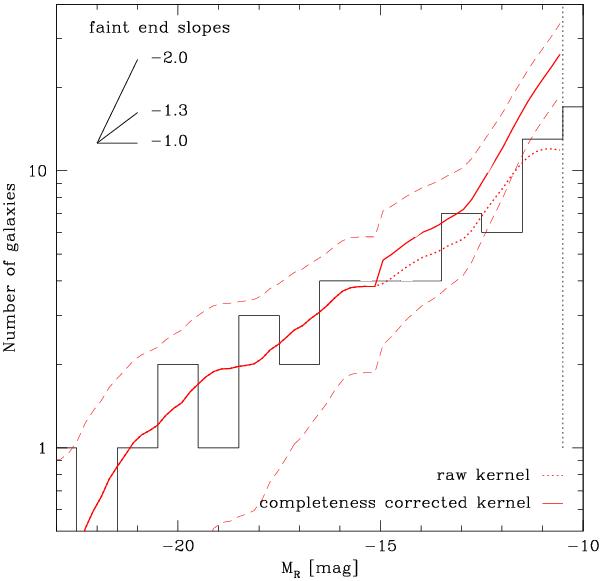
R-band luminosity function of members considered galaxies (see Fig. 7). The black histogram represents the observed data (bin width: 1 mag). The red dotted line is a binning-independent representation of the counts (Epanechnikov kernel of 1 mag bin width), while the red solid line is its completeness-corrected (see Sect. 3.1) counterpart with the 1σ uncertainty limits (dashed). The vertical dotted line is our 50% completeness limit at MR = −10.5 mag. For comparison, some faint end slopes are illustrated in the top left corner of the plot. The best fit slope to our data is α ~ −1.3, see text.
Current usage metrics show cumulative count of Article Views (full-text article views including HTML views, PDF and ePub downloads, according to the available data) and Abstracts Views on Vision4Press platform.
Data correspond to usage on the plateform after 2015. The current usage metrics is available 48-96 hours after online publication and is updated daily on week days.
Initial download of the metrics may take a while.