Fig. 11
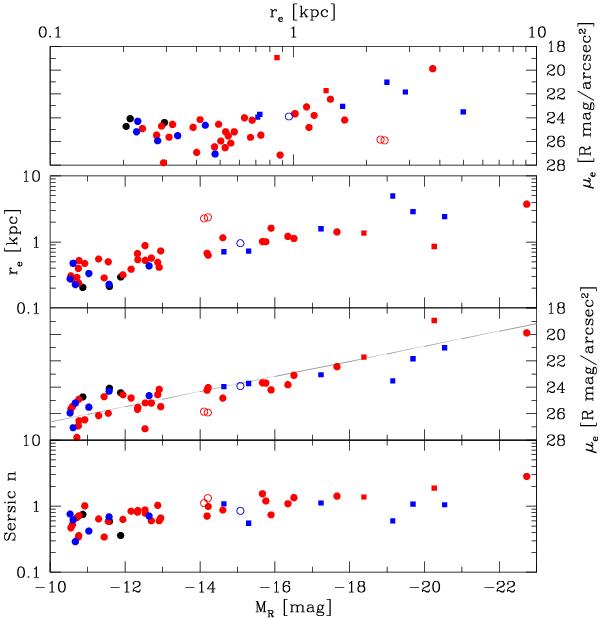
Photometric scaling relations of all investigated galaxies. Except for the total magnitude (curve-of-growth), all quantities arise from single Sérsic fits. In the case of spiral galaxies, the fit was performed to the disk; for dE,N only the main body was fitted. Symbols as in Fig. 7. While re is the effective radius, μe represents the effective SB (at re). The gray line in the μe − MR-plot gives the relation of Misgeld et al. (2009). The disrupted galaxy is not shown in this plot (no light profile available).
Current usage metrics show cumulative count of Article Views (full-text article views including HTML views, PDF and ePub downloads, according to the available data) and Abstracts Views on Vision4Press platform.
Data correspond to usage on the plateform after 2015. The current usage metrics is available 48-96 hours after online publication and is updated daily on week days.
Initial download of the metrics may take a while.