Free Access
Fig. 5
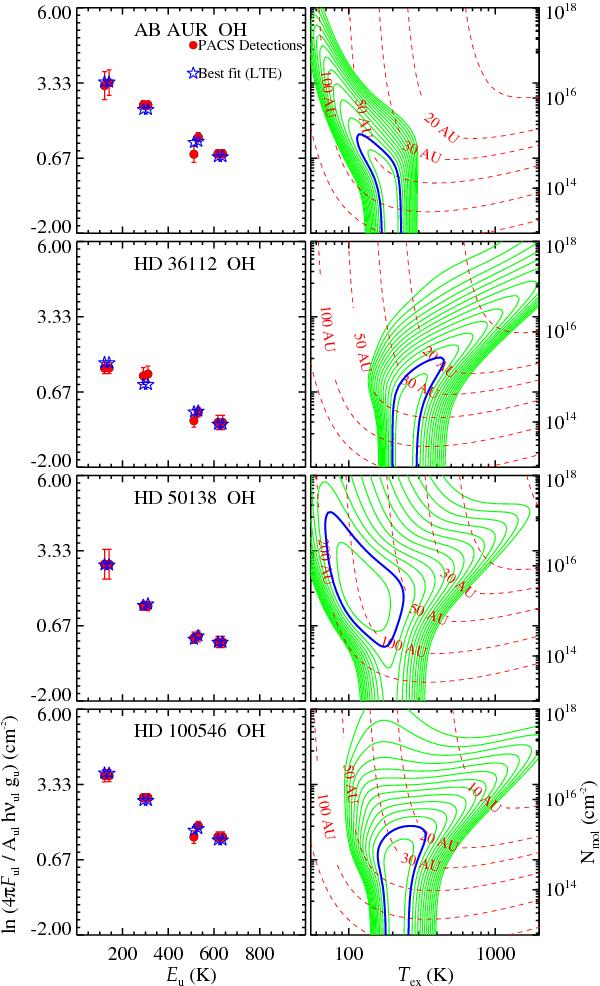
(Left) OH rotational diagram. PACS detections are plotted as (red) dots, best-fit model is shown as (blue) stars. (Right)  contours. The 1σ confidence level is highlighted by a (blue) thick line. The (red) dashed lines represent the emitting radius. The green lines are the contours in steps of 0.5.
Current usage metrics show cumulative count of Article Views (full-text article views including HTML views, PDF and ePub downloads, according to the available data) and Abstracts Views on Vision4Press platform.
Data correspond to usage on the plateform after 2015. The current usage metrics is available 48-96 hours after online publication and is updated daily on week days.
Initial download of the metrics may take a while.