Fig. 3
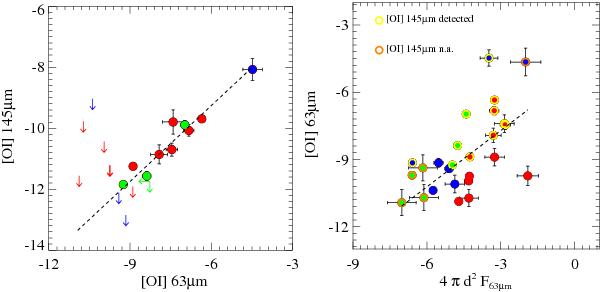
Correlations plots. The left panel shows the correlation between the oxygen fine structure lines. In the right panel F63 μm is the continuum flux at 63 μm: open yellow circles indicate objects with [O i] 145 μm detections; open orange circles indicate objects with [O i] 145 μm data not available. Detections are plotted as filled circle and upper limits as arrows, red for HAeBe group I, blue for HAeBe group II, green for TTs. All luminosities are expressed in L⊙ and are plotted on a logarithmic scale.
Current usage metrics show cumulative count of Article Views (full-text article views including HTML views, PDF and ePub downloads, according to the available data) and Abstracts Views on Vision4Press platform.
Data correspond to usage on the plateform after 2015. The current usage metrics is available 48-96 hours after online publication and is updated daily on week days.
Initial download of the metrics may take a while.