Free Access
Fig. A.1
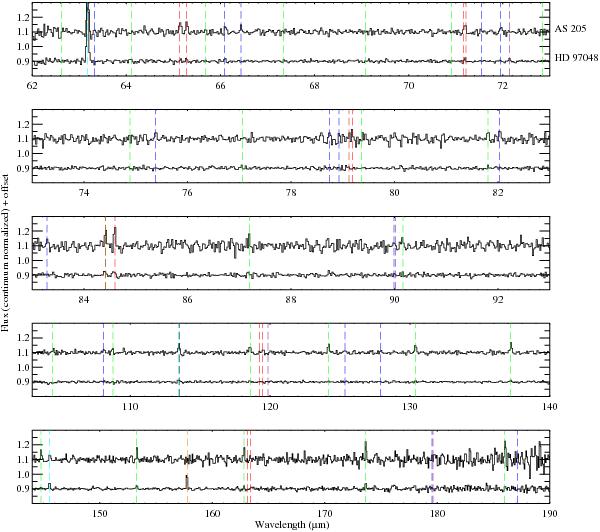
PACS spectrum of the T Tauri star AS 205 (top) and of the Herbig Ae star HD 97048 (bottom). The marks indicate the positions of [O i] (light blue), [C ii] (orange), CO (green), OH (red), H2O (blue) and CH+ (purple) lines.
Current usage metrics show cumulative count of Article Views (full-text article views including HTML views, PDF and ePub downloads, according to the available data) and Abstracts Views on Vision4Press platform.
Data correspond to usage on the plateform after 2015. The current usage metrics is available 48-96 hours after online publication and is updated daily on week days.
Initial download of the metrics may take a while.