Fig. A.5
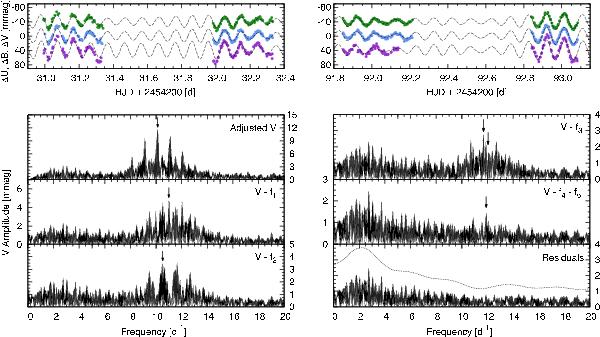
Frequency spectra of the β Cephei variable SBL303. The bottom panels show five steps in our data evaluation. The top panels show light curves for all bands. Since too many models passed through our error box, the mode identification panel is not displayed here. However, f3 shows increasing amplitude with wavelength which is only seen in l = 4 modes. All notations are the same as in Fig. A.3. The frequencies take the values f1 = 10.1225d-1, f2 = 10.991d-1, f3 = 10.5106d-1, f4 = 11.6904d-1, f5 = 12.045d-1, and f6 = 11.902d-1. Their errors range from σf1 = 0.0002d-1 to σf6 = 0.001d-1.
Current usage metrics show cumulative count of Article Views (full-text article views including HTML views, PDF and ePub downloads, according to the available data) and Abstracts Views on Vision4Press platform.
Data correspond to usage on the plateform after 2015. The current usage metrics is available 48-96 hours after online publication and is updated daily on week days.
Initial download of the metrics may take a while.