Fig. A.4
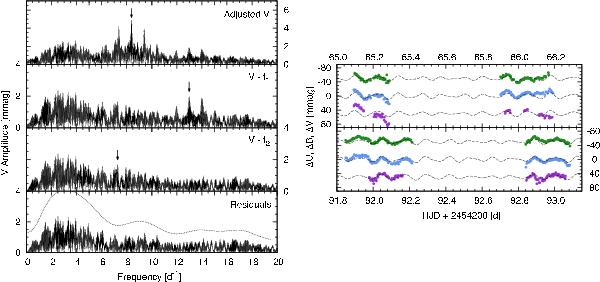
Frequency spectra and selected light curves for the β Cephei star SBL268. The analysis was performed with daily adjusted data, suppressing low frequencies. The notations and markings are the same as in Fig. A.3 where applicable. The frequencies found are f1 = 8.3847d-1, f2 = 12.9891d-1, and f3 = 7.2748d-1. The errors range from σf1 = 0.0004d-1 to σf3 = 0.001d-1 for the frequencies.
Current usage metrics show cumulative count of Article Views (full-text article views including HTML views, PDF and ePub downloads, according to the available data) and Abstracts Views on Vision4Press platform.
Data correspond to usage on the plateform after 2015. The current usage metrics is available 48-96 hours after online publication and is updated daily on week days.
Initial download of the metrics may take a while.