Fig. A.3
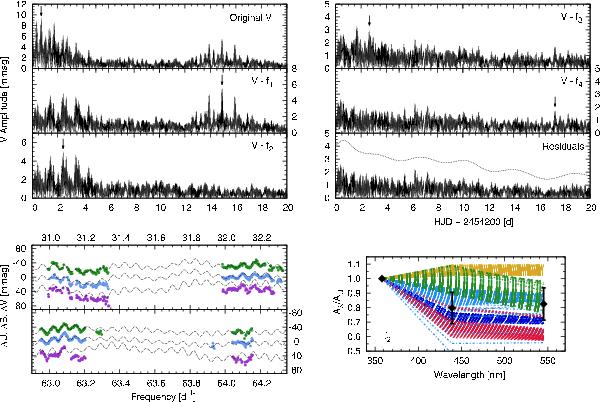
Frequency spectra of the β Cephei star SBL226 for the unadjusted data in V. Each of the panels in the top figures displays consecutive prewhitening steps at different states of the analysis. The last panel shows the residuals after subtracting five frequencies and the S/N = 4 threshold as a dotted line. The arrows in the individual panels mark each significant frequency throughout the analysis procedure. The bottom-left panels show exemplary light curves for all bands where purple represents data in U, blue in B, and green in V. The dashed lines represent the calculated multi-periodic fits. The graph in the bottom-right corner shows the mode identification where both the predicted and observed amplitude ratios are shown. We searched the grids for stars with masses ranging from 14 to 16M⊙. The various colours of the dotted lines represent theoretical pulsation modes ranging from l = 0 to l = 4. Dark blue corresponds to l = 0, red to l = 1, light blue to l = 2, green to l = 3, and yellow to l = 4. The black squares and their errorbars show the observed values. The determined frequencies take the values f1 = 0.7017d-1, f2 = 14.9098d-1, f3 = 2.4242d-1, f4 = 2.6579d-1, and f5 = 17.2502d-1 with errors ranging from σf1 = 0.0003d-1 to σf5 = 0.0013d-1.
Current usage metrics show cumulative count of Article Views (full-text article views including HTML views, PDF and ePub downloads, according to the available data) and Abstracts Views on Vision4Press platform.
Data correspond to usage on the plateform after 2015. The current usage metrics is available 48-96 hours after online publication and is updated daily on week days.
Initial download of the metrics may take a while.