Fig. A.1
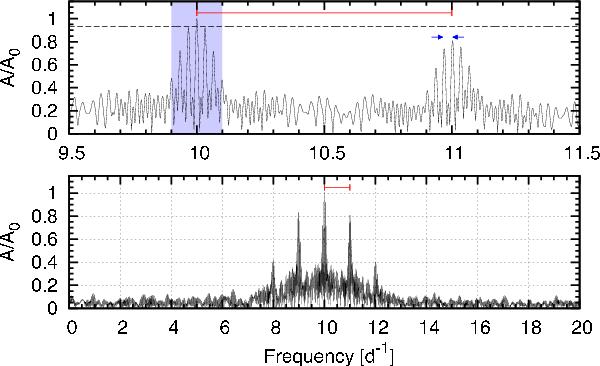
Spectral window of the observations. The bottom panel shows the overall structure of the window with daily aliases indicated by the red marker where the ± 1d-1 peaks reach about 80% of the strongest signal. The top panel displays a closer view revealing the monthly aliases (blue arrows) with a maximum signal at about 93% (dashed horizontal line). The region marked in blue denotes the size of the envelope of the monthly aliases which represents the length of a run in one month (which is about 5 days).
Current usage metrics show cumulative count of Article Views (full-text article views including HTML views, PDF and ePub downloads, according to the available data) and Abstracts Views on Vision4Press platform.
Data correspond to usage on the plateform after 2015. The current usage metrics is available 48-96 hours after online publication and is updated daily on week days.
Initial download of the metrics may take a while.