Fig. 2
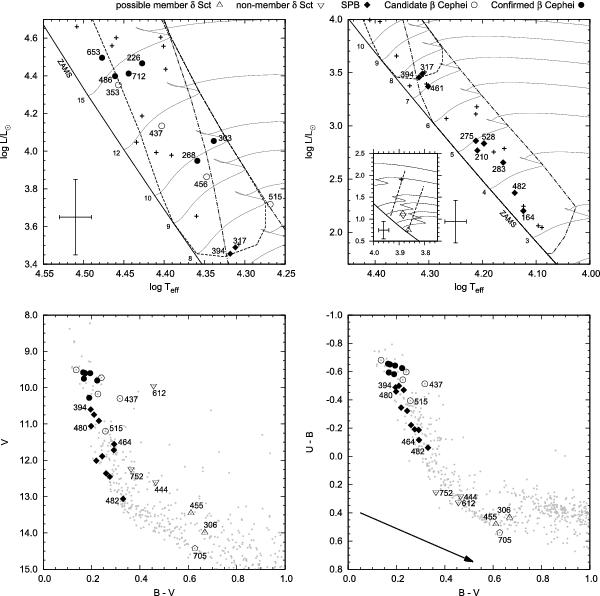
Positions of variable stars in our FOV in theoretical HR diagrams (top row), a colour-magnitude (bottom-left), and a colour-colour diagram (bottom-right). The number labels next to the data points represent the IDs of SBL98 used throughout our analysis. The HR diagrams also show the ZAMS (slanted full line), evolutionary tracks for different stellar masses where the mass is given in solar masses at their origin at the ZAMS, the β Cephei instability strip (dashed line), the SPB instability strip (dash-dotted line); the estimated error in Teff and log (L/L⊙) is indicated in the bottom-left corner of the individual plots, and additional cluster members that were not determined to be variable are shown as crosses. Both plots in the top row are theoretical HR diagrams but show different sections in the parameters space for a better visualisation of the results. The top-right plot also contains an inlay where a third region in the HR diagram, covering the δ Sculti instability domain (dashed lines), is displayed. Here the stars SBL306, SBL455, and SBL612 are plotted, where the first two are possible members of NGC 6231 and SBL612 is a foreground star. The bottom row shows the results of the SBL98 photometry. Only stars for which the position is important in the individual discussions are labelled here. In addition the reddening vector is indicated in the colour-colour diagram where the different groups of pulsators are very well separated. Only for SBL705 pulsations may not be the origin of its variability.
Current usage metrics show cumulative count of Article Views (full-text article views including HTML views, PDF and ePub downloads, according to the available data) and Abstracts Views on Vision4Press platform.
Data correspond to usage on the plateform after 2015. The current usage metrics is available 48-96 hours after online publication and is updated daily on week days.
Initial download of the metrics may take a while.