Fig. A.14
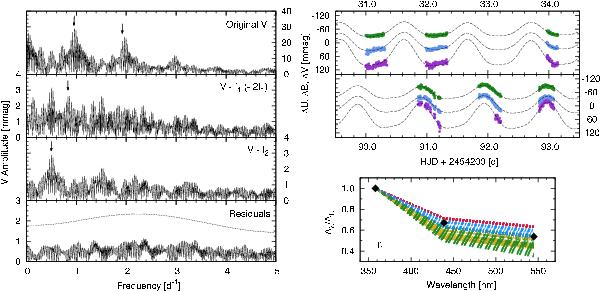
Frequency spectra, light curves, and amplitude ratios for the newly discovered SPB variable SBL210. Notations and markings are the same as in Fig. A.3. The amplitude ratios were calculated for masses between 4.5 and 5.5M⊙. The detected frequencies are f1 = 0.9615d-1, f2 = 0.8332d-1, f3 = 0.5004d-1, and 2f1. The errors in the frequencies range from σf1 = 0.00005d-1 to σf3 = 0.0006d-1.
Current usage metrics show cumulative count of Article Views (full-text article views including HTML views, PDF and ePub downloads, according to the available data) and Abstracts Views on Vision4Press platform.
Data correspond to usage on the plateform after 2015. The current usage metrics is available 48-96 hours after online publication and is updated daily on week days.
Initial download of the metrics may take a while.