Fig. 15
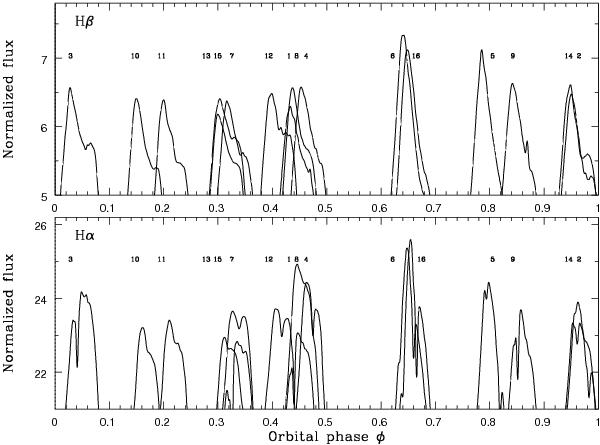
Hα (bottom panel) and Hβ (top panel) emission lines of MWC 314 show largest normalised flux maxima at φ ≃ 0.65 (spectrum Nos. 6 and 16), and smallest flux maxima at φ ≃ 0.32 (Nos. 13, 15, and 7). The absolute emission line fluxes determined with the V-brightness curve are however almost invariable, indicating that the extended circumbinary Hα and Hβ emission line formation regions are little influenced by the orbital motion.
Current usage metrics show cumulative count of Article Views (full-text article views including HTML views, PDF and ePub downloads, according to the available data) and Abstracts Views on Vision4Press platform.
Data correspond to usage on the plateform after 2015. The current usage metrics is available 48-96 hours after online publication and is updated daily on week days.
Initial download of the metrics may take a while.