Free Access
Fig. 1
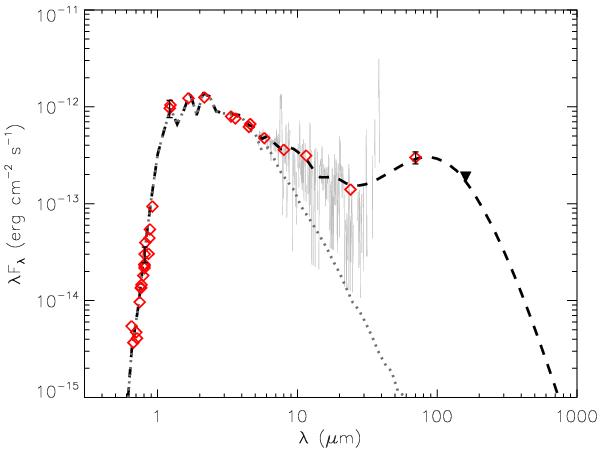
SED of OTS 44. Shown are photometric measurements (red diamonds) with errors if larger than the symbol, an upper limit for the 160 μm flux (black triangle), the mid-IR Spitzer/IRS spectrum (light gray), the best-fit SED model (dashed line), and the input BT-Settl photosphere model (gray dotted line).
Current usage metrics show cumulative count of Article Views (full-text article views including HTML views, PDF and ePub downloads, according to the available data) and Abstracts Views on Vision4Press platform.
Data correspond to usage on the plateform after 2015. The current usage metrics is available 48-96 hours after online publication and is updated daily on week days.
Initial download of the metrics may take a while.