Fig. 3
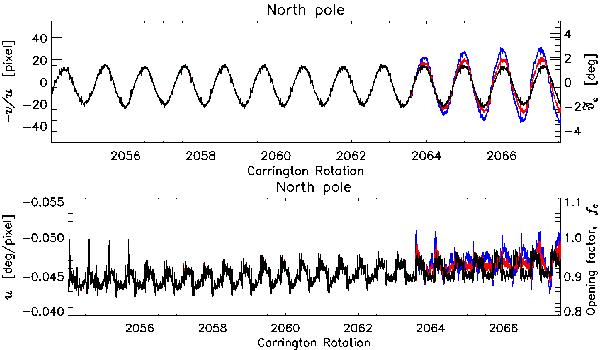
Time series of the intercept − v/u (upper panel) and the opening factor parameter u (bottom panel) as in Fig. 1 but calculated from the surface flux transport/current sheet source surface model (in black). The blue and red curves are the results from the model with extra sunspot groups corresponding to the synoptic magnetograms in Fig. 4, upper and middle panels, respectively. We only display the results for the northern hemisphere here.
Current usage metrics show cumulative count of Article Views (full-text article views including HTML views, PDF and ePub downloads, according to the available data) and Abstracts Views on Vision4Press platform.
Data correspond to usage on the plateform after 2015. The current usage metrics is available 48-96 hours after online publication and is updated daily on week days.
Initial download of the metrics may take a while.