Fig. 2
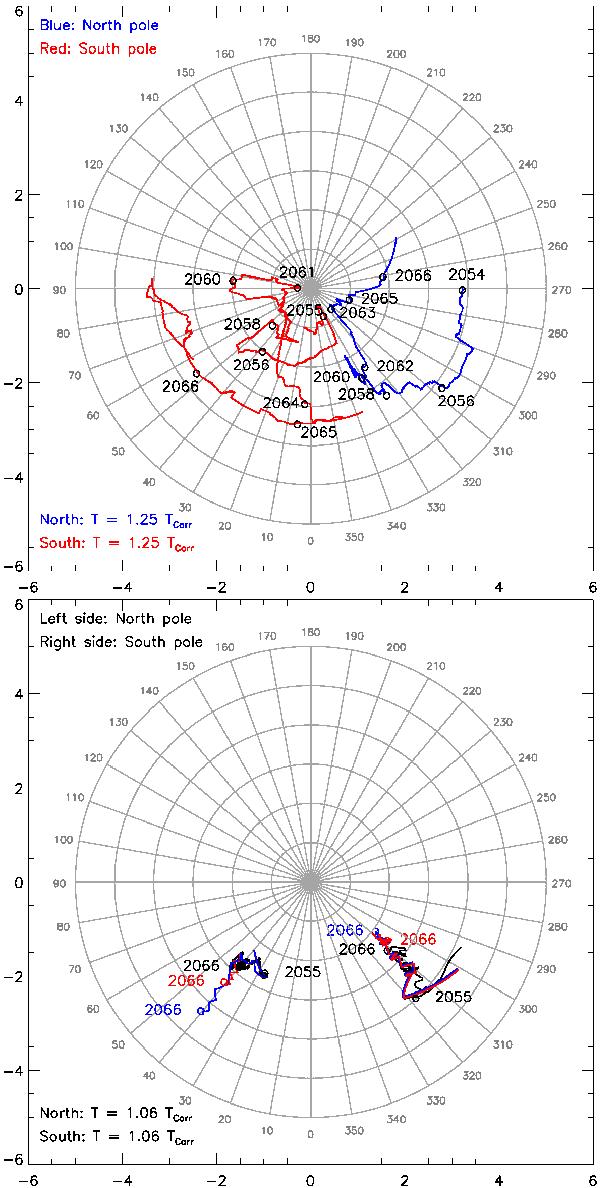
Evolution of the location of the Sun’s magnetic poles in a reference frame corotating with respect to the polar cap. North and south poles are drawn in blue and red, respectively. The concentric circles mark colatitudes from the heliographic pole in 1 degree steps. In the upper panel, the pole path is derived from the parameters displayed in Fig. 1. The rotational period that eliminates the average longitudinal drift of the north pole is 34.09 days. The lower panel shows the same evolution based on a surface flux transport simulation and a current sheet source surface extrapolation, in black. The rotational period of the nonaxisymmetric field was found in the simulation to be 28.67 days. The red and blue lines correspond to the model that includes artificial sunspots as discussed in the text.
Current usage metrics show cumulative count of Article Views (full-text article views including HTML views, PDF and ePub downloads, according to the available data) and Abstracts Views on Vision4Press platform.
Data correspond to usage on the plateform after 2015. The current usage metrics is available 48-96 hours after online publication and is updated daily on week days.
Initial download of the metrics may take a while.