Fig. 2
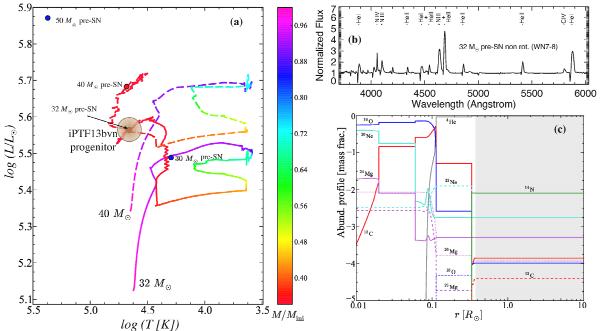
a) Hertzprung-Russell diagram showing the evolutionary tracks of non-rotating 32 M⊙ (solid) and 40 M⊙ models (dashed), with the red circles representing their endpoints. The location of the possible progenitor of iPTF13bvn is depicted by the brown region, whose size does not correspond to a formal error analysis and is merely indicative of the possible location of the progenitor. The color code refers to the mass at each timestep divided by Mini. The endpoints of the non-rotating 30 and 50 M⊙ models are also shown (blue circles). b) Continuum-normalized optical spectrum of the 32 M⊙ model at the pre-SN stage, showing it is a typical WN7–8 star (G13). The strongest features are identified. c) Chemical structure of our 32 M⊙ model at the end of the core carbon-burning stage, when the model has 10.9 M⊙. The variations in the mass fraction of different species is shown as a function of the radius, with the surface of the star being to the right, at 9.69 R⊙, and the center to the left at 0.0 R⊙.
Current usage metrics show cumulative count of Article Views (full-text article views including HTML views, PDF and ePub downloads, according to the available data) and Abstracts Views on Vision4Press platform.
Data correspond to usage on the plateform after 2015. The current usage metrics is available 48-96 hours after online publication and is updated daily on week days.
Initial download of the metrics may take a while.