Fig. 4
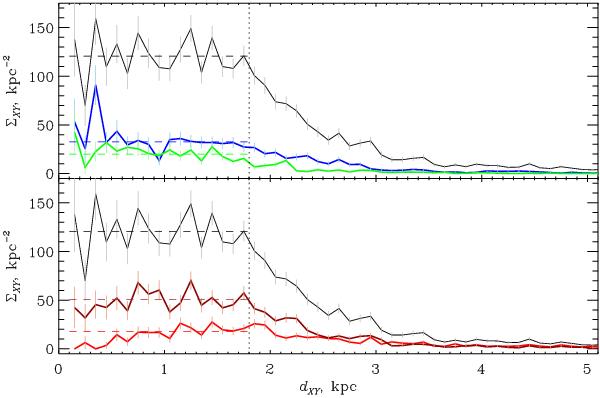
Distribution of the surface density ΣXY of star clusters versus distance dXY from the Sun projected onto the Galactic plane. The density distribution of all clusters is given in black in both panels. In the upper and lower panels we show the distributions of younger (blue: log t < 7.9, green: log t = 7.9...8.3) and older clusters (brown: log t = 8.3...9.0, red: log t > 9.0), respectively. The dotted vertical line indicates the adopted completeness limit, the dashed horizontal lines correspond to the average surface density within the completeness limit of clusters in different age groups.
Current usage metrics show cumulative count of Article Views (full-text article views including HTML views, PDF and ePub downloads, according to the available data) and Abstracts Views on Vision4Press platform.
Data correspond to usage on the plateform after 2015. The current usage metrics is available 48-96 hours after online publication and is updated daily on week days.
Initial download of the metrics may take a while.