Fig. 3
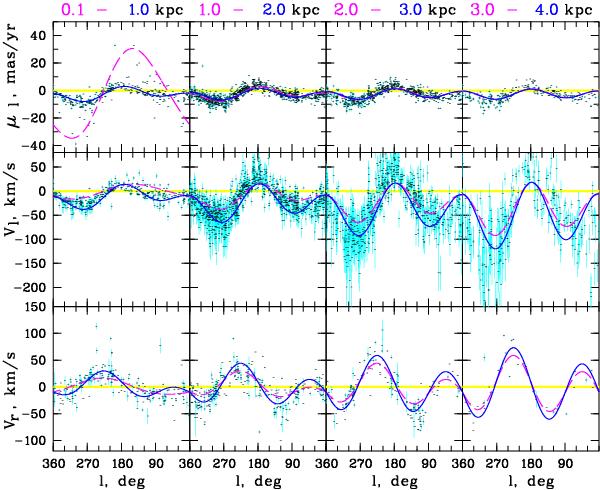
Observed (derived) kinematic data of open clusters within | b| ≤ 20° versus Galactic longitude for four ranges of projected distances dXY (as indicated at the top). The upper panels show proper motions, the middle panels tangential velocities, and the bottom panels RVs. Individual clusters are marked by thin horizontal lines with vertical error bars (in the RV panel, error bars are given only for clusters whose rms-errors could be estimated). For a given distance range, the curves show the systematic velocity components due to solar motion and local Galactic rotation computed with COCD-based values (Piskunov et al. 2006). The dashed curves correspond to the contributions at the smallest distance of a given distance range, whereas solid curves show this contribution at the largest distance. For example, in the upper left panel the dashed curve shows systematic variations versus longitude in proper motions expected for a cluster at 0.1 kpc from the Sun, whereas the solid curve shows these variations for a cluster at 1.0 kpc.
Current usage metrics show cumulative count of Article Views (full-text article views including HTML views, PDF and ePub downloads, according to the available data) and Abstracts Views on Vision4Press platform.
Data correspond to usage on the plateform after 2015. The current usage metrics is available 48-96 hours after online publication and is updated daily on week days.
Initial download of the metrics may take a while.