Fig. 3
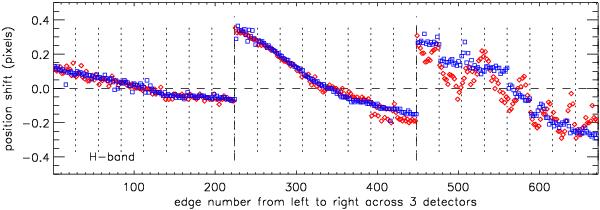
Shifts of slitlet edge positions (for the same band and rotator angle) when the temperature measured in the cryostat has changed by 2 K. Constant offsets have been removed, so that only the impact of stretching is shown. Left edges are plotted as red diamonds, right edges as blue squares. The dotted lines indicate the separation between IFUs, and the dashed lines between the 3 instrument segments. The pattern of data, as projected onto each detector, spans a width of about 2007 pixels. This figure shows that there is a differential shift of ~0.2–0.4 pixels in the location of the left-most and right-most edges on each detector; corresponding to a stretch of ~0.01–0.02% in the projected size of the pattern. While apparently a very small effect, this has a serious impact on the data calibration. The global shape in the figure probably originates in the spectrographs, while the more complex (intra-IFU structure) is likely associated with the image slicing optics.
Current usage metrics show cumulative count of Article Views (full-text article views including HTML views, PDF and ePub downloads, according to the available data) and Abstracts Views on Vision4Press platform.
Data correspond to usage on the plateform after 2015. The current usage metrics is available 48-96 hours after online publication and is updated daily on week days.
Initial download of the metrics may take a while.