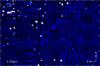
Fig. 15

Images from a KMOS mosaic of a region just to the south of the core of R 136. Top: 2.2–2.3 μm continuum. Middle: broad He II line emission at 2.19 μm. Bottom: broad Brγ line emission (the faint extended structure is narrow line emission that has not been fully rejected). The Wolf-Rayet stars, for which spectra are drawn in Fig. 16, have been identified in each plot by magenta arrows. All panels have been drawn on a linear scale using the colour bar shown underneath, with lowest values in black/blue and the highest values in red/white.


Current usage metrics show cumulative count of Article Views (full-text article views including HTML views, PDF and ePub downloads, according to the available data) and Abstracts Views on Vision4Press platform.
Data correspond to usage on the plateform after 2015. The current usage metrics is available 48-96 hours after online publication and is updated daily on week days.
Initial download of the metrics may take a while.